
If you’re an aspiring trader or even an experienced one looking to refine your strategies, understanding the concept of moving averages and their role in trading is crucial. In this guide, we’ll delve into the world of moving averages and explore how they can be used as powerful tools for making informed trading decisions.
1. What are Moving Averages?
Moving averages are widely used technical indicators that help traders identify trends and potential entry or exit points in the market. A moving average is a calculation that averages a specific number of data points over a given period, smoothing out price fluctuations and providing a clearer picture of the underlying trend.
By plotting moving averages on price charts, traders can gain insights into the overall direction of the market and make informed trading decisions. Whether you’re a day trader, swing trader, or long-term investor, understanding moving averages is essential for improving your trading outcomes.
2. Types of Moving Averages
There are several types of moving averages commonly used in trading, each with its own characteristics and applications. The three most popular types are:
Simple Moving Average (SMA)
The Simple Moving Average (SMA) is the most basic form of moving average calculation. It calculates the average price over a specific period by summing up the closing prices and dividing the sum by the number of periods. The SMA gives equal weight to all data points in the calculation.
Exponential Moving Average (EMA)
The Exponential Moving Average (EMA) gives more weight to recent price data, making it more responsive to price changes compared to the SMA. The EMA assigns a higher weight to the most recent data points, allowing it to react more quickly to market movements.
Weighted Moving Average (WMA)
The Weighted Moving Average (WMA) assigns different weights to each data point in the calculation. It places greater emphasis on recent prices, similar to the EMA, but also considers historical data. The WMA provides a balance between the SMA and EMA, offering a smoother line while still being responsive to price changes.
3. How to Calculate Moving Averages
To calculate a moving average, follow these steps:
- Determine the time period you want to analyze (e.g., 50 days).
- Sum up the closing prices for the specified number of periods.
- Divide the sum by the number of periods to get the average.
Repeat these steps for each subsequent period to obtain a moving average line on the price chart.
4. Popular Moving Average Timeframes
Different traders use various moving average timeframes depending on their trading style and objectives. Here are some commonly used timeframes:
- Short-term moving averages: 10-day, 20-day, and 50-day moving averages.
- Medium-term moving averages: 50-day, 100-day, and 200-day moving averages.
- Long-term moving averages: 200-day and 300-day moving averages.
The choice of timeframe depends on the trader’s preferred trading horizon and the market being analyzed.
5. Trading Strategies with Moving Averages
Moving averages can be employed in various trading strategies to generate buy and sell signals. Here are a few popular strategies:
Moving Average Crossover Strategy
The moving average crossover strategy involves using two moving averages with different timeframes, such as the 50-day and 200-day moving averages. When the shorter-term moving average (e.g., 50-day) crosses above the longer-term moving average (e.g., 200-day), it generates a buy signal. Conversely, when the shorter-term moving average crosses below the longer-term moving average, it generates a sell signal.
This strategy aims to identify trend reversals and capture substantial price moves.
Moving Average Support and Resistance Strategy
Moving averages can also act as dynamic support and resistance levels. Traders can use moving averages to identify potential areas of support during an uptrend or resistance during a downtrend. When the price approaches a moving average and bounces off it, it may indicate a potential trading opportunity.
By combining moving averages with other technical indicators, traders can enhance their support and resistance trading strategies.
Moving Average Breakout Strategy
The moving average breakout strategy involves waiting for the price to break above or below a moving average and entering a trade in the direction of the breakout. This strategy aims to capture significant price movements that occur after a period of consolidation.
Traders often use additional confirmation indicators, such as volume or momentum oscillators, to validate the breakout and increase the probability of a successful trade.
These are just a few examples of the many trading strategies that incorporate moving averages. Traders should thoroughly backtest and validate any strategy before using it in live trading.
6. Golden Cross and Death Cross
The Golden Cross and Death Cross are two significant events that traders often monitor when using moving averages. These events can signal potential shifts in market trends.
Golden Cross
The Golden Cross occurs when a shorter-term moving average (e.g., 50-day) crosses above a longer-term moving average (e.g., 200-day). It is considered a bullish signal and suggests a potential uptrend in the market.
Traders often view the Golden Cross as an opportunity to enter long positions or add to existing ones.
Death Cross
The Death Cross, on the other hand, happens when a shorter-term moving average crosses below a longer-term moving average. It is a bearish signal and indicates a potential downtrend in the market.
Traders may interpret the Death Cross as a signal to exit long positions or consider shorting the market.
7. Using Moving Averages as Support/Resistance
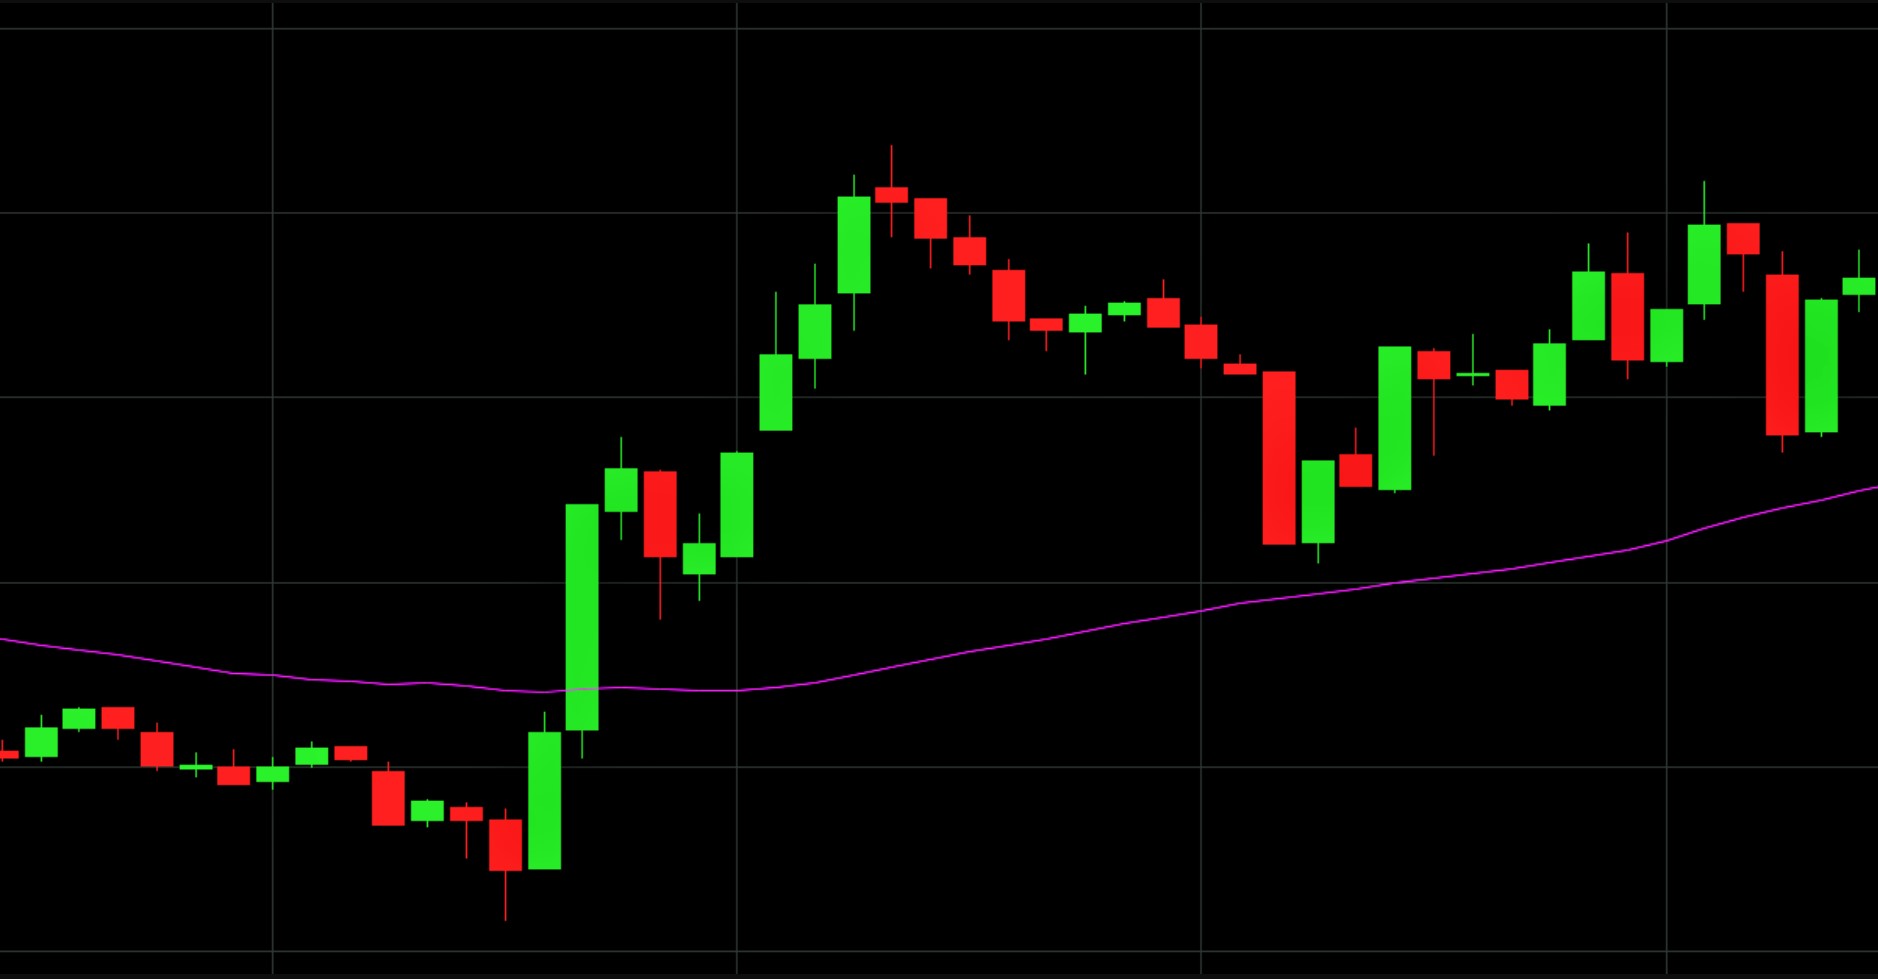
Moving averages can act as dynamic support or resistance levels, providing valuable insights into potential price reversals or continuation patterns. When the price approaches a moving average, it often encounters support (in an uptrend) or resistance (in a downtrend).
Traders can use moving averages alongside other technical indicators to confirm support or resistance levels and make informed trading decisions. The confluence of multiple indicators increases the likelihood of a successful trade.
8. Moving Average Convergence Divergence (MACD)
The Moving Average Convergence Divergence (MACD) is a popular technical indicator that incorporates moving averages to identify trend changes and generate trading signals. The MACD consists of three components:
- MACD Line – This line represents the difference between two moving averages (usually the 12-day EMA and the 26-day EMA).
- Signal Line – The Signal Line is a moving average (typically a 9-day EMA) of the MACD Line.
- Histogram – The Histogram visualizes the difference between the MACD Line and the Signal Line.
Traders use the MACD to identify bullish and bearish crossovers, overbought and oversold conditions, and potential trend reversals.
9. Swing Trading with Moving Averages
Swing trading is a trading style that aims to capture short to medium-term price swings within an established trend. Moving averages can be valuable tools for swing traders, helping them identify potential entry and exit points.
Swing traders often use a combination of shorter-term and longer-term moving averages to confirm trend direction and timing. By waiting for price pullbacks to the moving averages in an uptrend or bounces off the moving averages in a downtrend, swing traders can enter trades with favorable risk-reward ratios.
10. Backtesting Moving Average Strategies
Backtesting is a crucial step in developing and validating trading strategies. By applying historical data to a trading strategy, traders can assess its performance and determine its potential profitability.
When backtesting moving average strategies, traders simulate trades based on specific rules and parameters to evaluate their effectiveness. They analyze performance metrics such as win rate, profit factor, and maximum drawdown to assess the strategy’s viability.
It’s important to note that past performance does not guarantee future results. However, backtesting can provide valuable insights into a strategy’s strengths and weaknesses.